
Latin America Connector Market Size and Forecast by Product Type, Price Range, End Product, Voltage Range, and Distribution Channel: 2019-2033
July 2025
| Format:

 |
Pages: 160+
|
Type: Industry Report
|
Authors:
David Gomes
(Manager – Semiconductor)
|
Pages: 160+
|
Type: Industry Report
|
Authors:
David Gomes
(Manager – Semiconductor)
MARKET OUTLOOK
Latin America Connector Market Outlook
AI-Enhanced Modular Connectivity Transforming Latin America Connector Landscape
Latin America connector industry is entering a dynamic phase driven by modular computing, AI-automated design tools, and photonic interconnect requirements. The region’s transition toward intelligent devices, cloud infrastructure, and advanced server frameworks is accelerating demand for high-performance, scalable connector formats that can meet the evolving demands of digital and industrial systems. Startups across Brazil, Chile, and Colombia are actively driving connector innovations that align with optical signal transmission, hot-swappable interfaces, and precision-fit modular components.
The Latin America connector market is projected to reach USD 7.93 billion by 2033, registering a CAGR of 7.6% from 2025 to 2033. This growth is supported by strong investments in datacenter expansion, smart mobility platforms, and photonic communication systems. Countries like Brazil are leveraging edge computing frameworks and IoT adoption across agriculture and energy, propelling demand for rugged circular connectors and RF interfaces. At the same time, Chile is exploring quantum-safe data networks where optical connectors play a foundational role in low-latency and high-fidelity transmission. The shift toward AI-enhanced rapid design and low-latency interconnects is propelling the connector sector into the core of regional digital transformation.
Infotainment Expansion and Semiconductor Complexity Fueling Connector Market Maturity
Automotive electrification and infotainment expansion have emerged as strong catalysts for connector growth across Latin America. As vehicle OEMs introduce connected infotainment dashboards, in-vehicle data interfaces require high-speed, vibration-resistant I/O rectangular and RF connectors to support seamless connectivity between displays, cameras, and telematics modules. Argentina and Brazil have seen robust automotive recovery, spurring upstream demand for onboard connectivity solutions.
The regional semiconductor packaging sector, while nascent, is evolving in collaboration with foreign technology partners. As chipsets become denser, signal and power routing within compact spaces demands high-precision, high-density PCB connectors and terminal blocks that withstand thermal cycling and miniaturization stress. This complexity has encouraged connector vendors to expand their footprint in local prototyping labs, supporting hybrid packaging solutions.
The connector ecosystem is also strengthened by rising consumer demand for wearables and smart appliances that use flexible and low-profile interfaces. This has opened opportunities for connector designs that cater to quick product refresh cycles and aesthetic integration, further supported by Latin America’s emerging design hubs.
Design Obsolescence and Regulatory Inefficiencies Challenge Market Scalability
Despite structural momentum, several inhibitors restrict the full potential of the Latin America connector market. Regulatory delays, particularly in customs clearance and import tariffs on specialized connector components, impact the flow of critical infrastructure hardware. Brazil has implemented inconsistent tariff structures on modular industrial components, creating delays in equipment deployment and driving up costs for manufacturers.
Design obsolescence remains a key challenge, as many industrial systems still rely on outdated connector frameworks incompatible with AI-era architectures. Legacy server rooms, power systems, and transport vehicles often lack the backward-compatible interfaces needed to adapt to new modules, leading to fragmented upgrade paths. Additionally, fluctuating FX rates and political instability in regions like Venezuela and Argentina disrupt long-term procurement planning, limiting connector vendors from committing to regional inventory investments.
Furthermore, engineering talent shortage in precision connector design disciplines hampers innovation capacity in smaller nations. This restricts the scaling of connector R&D and weakens supply chain resilience against global demand surges.
Optical Interconnects and Tool-Less Systems Shaping Next-Gen Connector Demand
Latin America is witnessing a rise in the adoption of hot-swappable and tool-less connector systems, particularly in renewable energy, modular workstations, and industrial robotics. The ability to replace, upgrade, or service connectors without halting entire systems is revolutionizing uptime in factories and datacenters. This is especially relevant in Colombia and Chile, where smart mining initiatives depend on rapid interchangeability in extreme environments.
Additionally, the connector landscape is evolving in response to the growing interest in photonic and optical interconnects, primarily driven by the exponential growth of Latin America’s digital traffic. Brazil is rolling out AI-accelerated datacenter nodes that require optical fiber connectors with minimal insertion loss and high mating durability.
Push-pull locking mechanisms and slimline connector profiles are becoming default choices for data-intensive environments, particularly in medical imaging and edge computing applications where size and performance must be balanced.
Modular Computing and Quantum-Compatible Interconnects Unlocking Strategic Opportunities
Latin America is rapidly becoming fertile ground for modular computing infrastructure, with national governments backing open-server architecture policies. Connector vendors are tailoring their offerings for blade servers, compact GPUs, and scalable AI chipsets. High-current terminal blocks and low-profile IC sockets are gaining popularity as demand intensifies for datacenter performance optimization without compromising thermal management.
Moreover, a unique opportunity lies in quantum computing experimentation across Brazil and Chile, where universities and research labs are working on early-stage photonic transmission systems. This calls for ultra-low-noise, high-frequency connectors and optical fiber interfaces capable of supporting terabit-scale transmissions. These advanced designs are gradually finding commercial utility in telecom hardware, pushing connector suppliers toward future-ready, ultra-durable optical interfaces.
Additionally, the Latin American textile tech industry is exploring smart garments and biosensor-based fabrics, which are opening a new chapter in connector miniaturization and printable formats.
Regulatory Push for Localization and Digital Infrastructure Development
The connector sector in Latin America is increasingly influenced by government-led digital infrastructure expansion, telecom liberalization, and hardware localization mandates. Brazil’s Lei do Bem (Good Law) offers tax exemptions for R&D-intensive hardware development, supporting connector manufacturers involved in precision signal and power interface production.
Meanwhile, Argentina and Peru are integrating connector design into smart city blueprints, enabling standardized formats across smart lighting, grid sensors, and transit control systems. Regulatory efforts to streamline RoHS compliance and signal integrity testing in Chile and Colombia are also helping connector suppliers meet international standards. However, delays in harmonized certification protocols across regional blocs like Mercosur continue to pose entry barriers for foreign connector players.
Startups, Aesthetics, and AI Tools: Shaping the Future of Latin America’s Connector Innovation
The region’s connector industry is increasingly benefiting from the convergence of aesthetic sensitivity in product design and the agility of local startups. Brazil’s wearables market and Colombia’s smart appliance clusters demand connectors that match sleek consumer product designs while remaining thermally robust and low-profile. This demand is being met through AI-driven design automation tools that accelerate connector prototyping and surface routing optimization.
AI-assisted tools are enabling small connector manufacturers to develop market-ready designs with faster turnarounds, addressing key pain points in component integration and compliance. This confluence of aesthetic trends, digital design, and entrepreneurial agility is setting Latin America apart as a flexible design-driven hub in the global connector landscape.
Latin America Connector Market Positioned for Scalable, Photonics-Driven Growth
Amid rising data loads, precision electronics, and AI-powered device networks, Latin America’s connector industry stands at the cusp of scalable growth. The transition toward modular, tool-less, and photonic interconnects, supported by startup energy and regulatory focus, will define the next chapter of the region’s digital infrastructure. While challenges remain in harmonizing standards and talent availability, the convergence of government policy, design innovation, and strategic OEM alliances continues to shape a resilient and adaptive connector ecosystem.
*Research Methodology: This report is based on DataCube’s proprietary 3-stage forecasting model, combining primary research, secondary data triangulation, and expert validation.
[Learn more]
Latin America Connector Market Segmentation
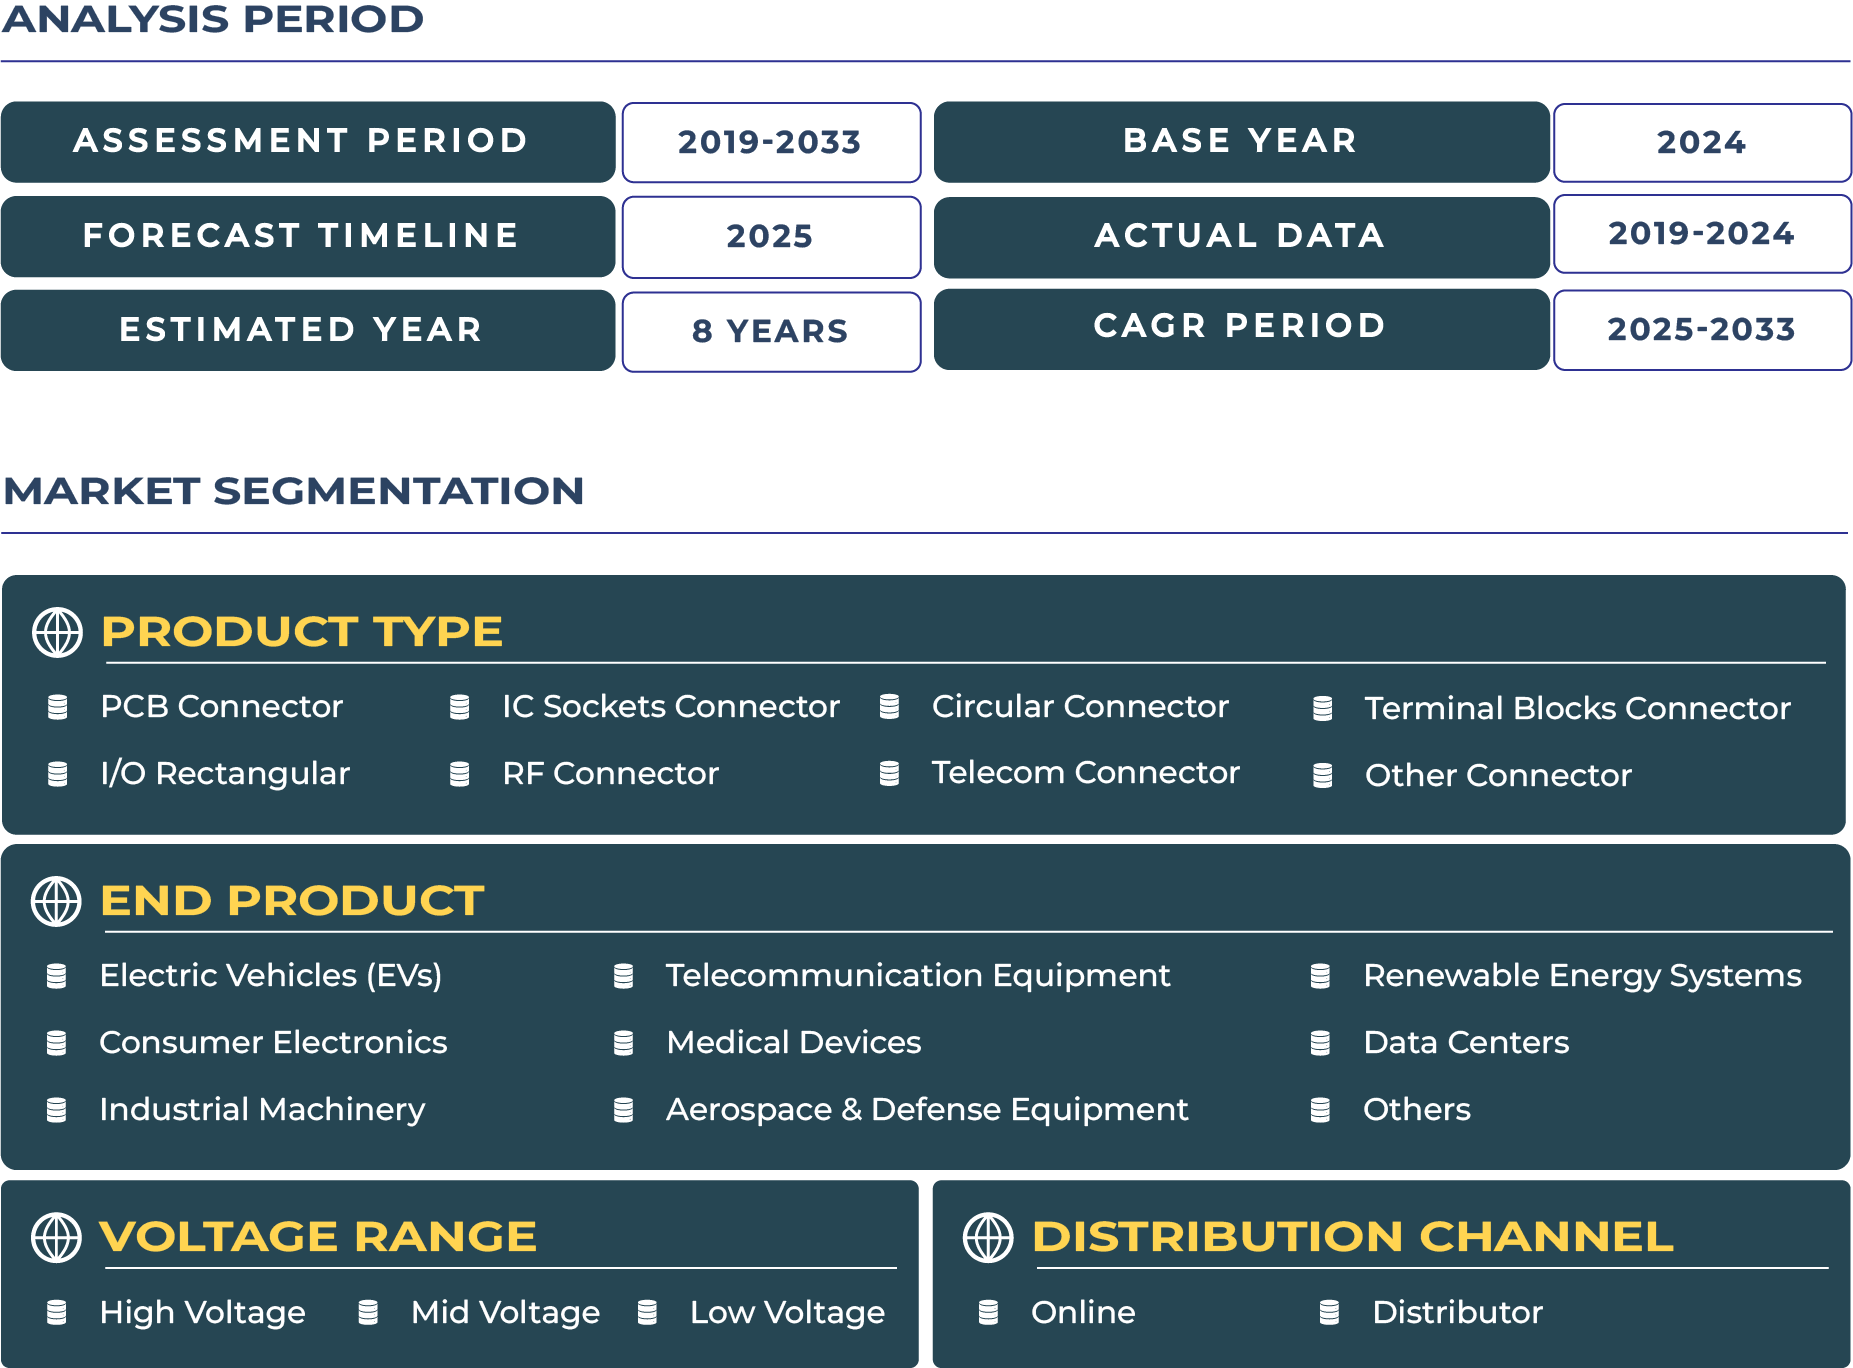
Latin America Connector Market Country Coverage

Frequently Asked Questions
They allow faster prototyping and precise routing, enabling sleek modular connector systems aligned with modern electronics.
They support high-speed, low-latency data transfer critical for AI acceleration and quantum computing experiments.
They blend thermal durability with sleek design, meeting both functionality and visual appeal in emerging wearable and medical devices.
Related Reports

India Public Cloud Market Size | 2019-2033
- Report ID: IT1775 | Coverage: Country |
- Category: Information Technology | Sub-Category: IT Software & Services |
- Published Date: Jul 2025 | US$495 |
Kenya InsurTech Market Size | 2019-2033
- Report ID: IAS155 | Coverage: Country |
- Category: Insurance and Securities | Sub-Category: InsurTech |
- Published Date: Sep 2025 | US$495 |
India Public Cloud Market Size | 2019-2033
- Report ID: IT1775 | Coverage:Country |
- Category:Information Technology | Sub-Category: IT Software & Services |
- Published Date: Jul 2025 |US$495 |
Kenya InsurTech Market Size | 2019-2033
- Report ID: IAS155 | Coverage:Country |
- Category:Insurance and Securities | Sub-Category: InsurTech |
- Published Date: Sep 2025 |US$495 |
Why Choose Us

24/5 Research Support
Get your queries resolved prior to and post purchasing research study

Customize As Per Specific Requirements
Get in-depth analysis based on your tailored research needs

Expertise in Tracking Niche Markets
Comprehensive view of latest technologies and opportunities across markets

360-Degree Analysis
Fact-based insights derived through supply & demand side analysis

Assured Quality
Deliver most accurate industry insights to maintain research quality

Information Security
Your confidential and personal data is secure and safe