MEA Entertainment Market Size and Forecast by Content Type, Content Origin, Rights Commercialization Type, Revenue Model, and End User: 2019-2034

Jul 2026
Format:
PDF Excel
Pages: 160+
Type: Industry Report
USD 82.39 Billion
Market Size 2026
USD 131.97 Billion
Forecast 2034
6.07%
CAGR 2026–2034

MEA's live entertainment venue and immersive experience infrastructure gap limits independent content monetization authority despite high youth-demographic audience engagement levels.

MEA Entertainment Market Size | 2019-2034
Media and Entertainment
Entertainment

Market Outlook

  • In 2026, the MEA industry is estimated at USD 82.39 Billion, reflecting a YoY increase of -11.78%.
  • The MEA Entertainment Market will reach USD 131.97 Billion by 2034, achieving an expected CAGR of 6.07% over the forecast timeline.
Industry Shift: The Youth Demographic Monetization Deficit
MEA's large and digitally active youth population generates substantial audience engagement across mobile gaming, streaming, and creator-led content, yet monetization infrastructure — including payment rails, subscription platforms, and venue capacity — remains underdeveloped relative to that audience scale.

MEA Youth Audience Scale Outpaces Regional Monetization Infrastructure

Payment infrastructure constraints across much of the MEA entertainment sector — specifically the limited reach of card-linked subscription rails outside Gulf Cooperation Council markets, fragmented mobile-money integration with streaming billing systems, and underdeveloped live venue capacity in North Africa and Sub-Saharan Africa — have decoupled audience scale from revenue conversion for independent content operators. MEA carries one of the largest youth populations globally, yet this demographic concentration has not produced proportionate subscription penetration or rights-commercialization depth. Mobile gaming and creator-led short-form content absorb the largest share of youth audience time, though monetization authority for both formats is concentrated in platform intermediaries operating payment, discovery, and distribution infrastructure that most domestic operators do not control. The more consequential structural condition is not audience disengagement but the absence of payment rails capable of converting that engagement into recurring operator revenue at regional scale.

Fragmented rights-management systems across MEA's filmed, episodic, and live performance segments compound the payment-infrastructure deficit by preventing independent operators from licensing or commercializing content across territory boundaries with the efficiency available to platform operators holding region-wide rights portfolios. Cross-border rights commercialization in the MEA entertainment sector remains concentrated among a small group of multinational distributors and platform operators with established legal infrastructure in multiple jurisdictions, leaving domestically originated content with limited territory-specific licensing revenue. Subscription penetration in markets such as Egypt, Nigeria, and Kenya remains structurally constrained by the mismatch between platform pricing and local purchasing power — a condition that ad-supported models have partially addressed, though ad-supported architectures transfer monetization authority further toward advertisers rather than content originators. Platform investment in venue development and rights infrastructure across the region is likely to remain selective and concentrated in Gulf markets, where sovereign investment frameworks and consumer spending capacity present more direct revenue conversion conditions than the broader MEA geography currently offers.

How Mobile-Money Fragmentation Limits Independent Operator Subscription Conversion

Independent streaming and content operators serving Sub-Saharan Africa and North Africa face billing system incompatibility as the primary constraint on subscription revenue conversion, not audience disengagement. Mobile-money platforms — including M-Pesa in East Africa and Orange Money across Francophone West Africa — operate under distinct API architectures that most regional streaming operators lack the technical resources to integrate simultaneously, concentrating recurring billing capability among a small number of platform intermediaries with pre-existing carrier agreements. At least in part because these integration costs fall disproportionately on independent operators rather than on international platform holders, domestically produced content in the MEA entertainment sector generates audience engagement without producing the subscription revenue or rights-commercialization income that the same audience scale would yield in markets with unified payment rails. The more likely consequence — given that mobile-money account penetration continues to outpace card-linked payment adoption across much of Sub-Saharan Africa — is that independent operators remain structurally dependent on ad-supported revenue models offering narrower per-user returns than subscription or transactional licensing frameworks accessible to platform operators controlling regional payment infrastructure.

Mobile-Money Integration Gaps Create Billing Infrastructure Demand

Capital flowing into MEA entertainment infrastructure has concentrated at the platform layer rather than the billing-integration layer, leaving independent streaming operators in Sub-Saharan Africa and North Africa without compatible recurring-payment tooling. The structural gap here is the absence of a unified payment-orchestration layer capable of translating mobile-money account relationships — across distinct API architectures operated by carriers in East Africa and Francophone West Africa — into subscription billing events that independent content operators can collect and reconcile. Vendors offering pre-integrated, multi-wallet billing middleware positioned specifically for independent streaming operators stand to address a capability deficit that platform intermediaries currently exploit as a competitive moat, converting mobile-money account penetration into recurring operator revenue rather than ad-dependent engagement returns.

Behind Mobile-Money Billing Gaps and Operator Revenue

What the surface data understates is that mobile-money account penetration across Sub-Saharan Africa has materially outpaced the ability of independent streaming operators to convert those accounts into recurring subscription revenue, making billing-system compatibility — rather than audience reach — the operative constraint on operator income. M-Pesa's active account base in East Africa and Orange Money's footprint across Francophone West Africa represent aggregated payment capacity that independent content operators cannot access without carrier-specific API integrations that most lack the capital to build. The more consequential indicator is therefore the ratio of mobile-money account holders to independently operated subscription billing events: where that ratio widens, independent operators in the MEA entertainment sector absorb audience scale without capturing proportionate revenue, while platform intermediaries holding pre-negotiated carrier agreements continue converting the same account base into subscription income. This divergence, observable wherever mobile-money penetration advances faster than billing-middleware deployment, structurally anchors independent operators to ad-supported revenue models offering narrower per-user returns.

Despite Mobile Penetration Gains, Rights Conversion Remains Structurally Blocked

Independent content operators across Sub-Saharan Africa and North Africa are absorbing substantial audience reach without capturing the licensing or rights-commercialization income that reach of equivalent scale generates in markets with functional rights-registration infrastructure. The structural mechanism producing this outcome is the absence of territory-specific rights-clearance systems capable of validating ownership claims across MEA's filmed, episodic, and live performance segments — a gap that prevents independent operators from executing cross-border licensing transactions even where counterparty demand exists. Without verified rights provenance, buyers in adjacent MEA territories cannot legally acquire content from domestic independent producers, concentrating licensing revenue among platform intermediaries that hold pre-cleared, region-wide rights portfolios rather than among the originating operators who created the underlying content. The more consequential implication, at least in part because rights-registration infrastructure investment has followed platform capital rather than independent operator need, is that mobile-money account penetration and youth audience scale together fail to generate proportionate rights-based income for the segment of the MEA entertainment sector that carries the highest exposure to this structural deficit.

MEA Entertainment Market Analysis By Country

Saudi Arabia Vision 2030 entertainment licensing reforms have expanded live performance venue capacity and licensed cinema screens, structurally widening ticketed revenue conversion beyond digital subscription formats.

UAE Consolidated payment infrastructure and high card-linked subscription penetration position the UAE as the MEA region's most mature rights-commercialization and transactional licensing environment.

Qatar Sports-event rights investment and premium live entertainment capacity have concentrated monetization around ticketed and sponsorship models rather than subscription or ad-supported revenue frameworks.

Kuwait High per-capita income alongside underdeveloped domestic content production capacity directs entertainment expenditure predominantly toward imported subscription and transactional platforms rather than locally originated rights.

Oman Limited domestic production infrastructure and a relatively small addressable audience constrain independent content operators to ad-supported revenue, reducing rights-commercialization depth across filmed and episodic segments.

Bahrain Proximity to Saudi Arabia's expanding entertainment economy positions Bahrain as a secondary live-event and location-based entertainment market, with monetization tied closely to regional spillover demand.

Turkey Established scripted television production capacity and active international licensing activity make Turkey a net content exporter, with rights-commercialization income exceeding most MEA peers in episodic formats.

South Africa Developed broadcast and filmed production infrastructure coexists with fragmented township-level payment access, limiting independent operator subscription conversion outside major metropolitan subscription catchment areas.

Israel Advanced digital payment infrastructure and high broadband penetration support subscription and transactional revenue conversion, with a locally competitive gaming and interactive entertainment segment attracting international publisher interest.

Nigeria Africa's largest youth audience base generates substantial engagement across mobile gaming and short-form content, yet card-linked billing limitations structurally anchor independent operators to ad-supported rather than subscription revenue models.

Kenya M-Pesa's dominant mobile-money penetration creates a theoretically addressable subscription billing base, though independent streaming operators lack the carrier API integrations needed to convert that base into recurring revenue.

Zimbabwe Currency instability and constrained disposable income compress transactional and subscription revenue potential, concentrating audience entertainment consumption within ad-supported and free-access formats rather than rights-based commercialization channels.

The Rights-Control Divide Structuring MEA Entertainment Competition

The MEA entertainment sector's competitive field has moved toward platform consolidation and rights aggregation, away from the format-specific rivalries that defined the previous decade. Key vendors now span filmed entertainment, episodic programming, music, gaming, live performance, and location-based experiences, with competitive positioning determined primarily by rights portfolio depth and payment infrastructure reach. Netflix maintains broad subscription video-on-demand coverage across GCC markets, while Anghami—operating the combined OSN+ video and music platform—competes across recorded music, episodic content, and live event verticals following its integration with OSN Group. MBC Group's Shahid anchors Arabic scripted and unscripted programming in the episodic segment. beIN Media Group holds sports rights and pay-TV infrastructure across GCC and North Africa. Spotify operates across music and audio entertainment formats in the MEA entertainment sector. Live Nation Arabia covers live music performance and festival promotion, having operated the Maraya Concert Hall venue in AlUla under a partnership. StarzPlay, operating as Starz Arabia, serves the transactional and subscription filmed entertainment segment.

Warner Bros. Discovery's $57 million minority investment in OSN Streaming Limited, securing exclusive HBO and Max Originals distribution across MENA, illustrates the field-level pattern most clearly: major operators are consolidating rights across audio, video, and live formats rather than competing within single-format boundaries. Anghami's bundling initiatives with Shahid and Disney+ further reflect an aggregation logic in which distribution breadth and content exclusivity—not audience reach alone—determine recurring subscription revenue. Across the competitive field, telco-bundled distribution has become a standard subscriber acquisition mechanism; Anghami's network of telecom operator partnerships reflects how platform operators convert carrier relationships into billing access across markets where direct card-linked payment rails are limited.

The more consequential competitive divide runs between operators that hold pre-cleared, region-wide rights portfolios and those confined to territory-specific or format-specific licensing arrangements. Arguably the bigger structural constraint for mid-tier and independent operators is that rights provenance gaps—particularly across Sub-Saharan Africa and North Africa—prevent cross-border licensing transactions even where buyer demand exists, channelling licensing income toward platform intermediaries rather than originating producers. This asymmetry compounds the monetization gap that characterises the wider MEA entertainment market: youth audience scale accumulates at the independent and creator-led content layer, while subscription and transactional revenue concentrates among platform operators whose rights infrastructure and payment integration capacity already operate at regional scale.

Market Scope

Comprehensive breakdown of market scope across key dimensions View Full Methodology
Segment Dimension
Segment Items
Content Type
Filmed Entertainment Television & Episodic Entertainment Music & Audio Entertainment Gaming & Interactive Entertainment Live Performance & Event Entertainment Location-Based Entertainment
Content Origin
Studio / Publisher-Originated Independent Professional Creator-Led User-Generated Third-Party Acquired / Licensed
Rights Commercialization Type
Ownership Transfer Exclusive Rights Licensing Non-Exclusive Rights Licensing Limited-Term Rights Licensing Territory-Specific Rights Licensing Usage-Specific Rights Licensing
Revenue Model
Subscription-Based Ad-Supported Transactional (Pay-per-use) Sponsorships/Brand Deals Ticket Sales & Merchandise
End User
Individual Consumers Businesses/Advertisers Educational Institutions Corporate Enterprises Gamers & Streamers Others (Social media influencers, Fan communities, Fan communities etc.)
Countries Covered
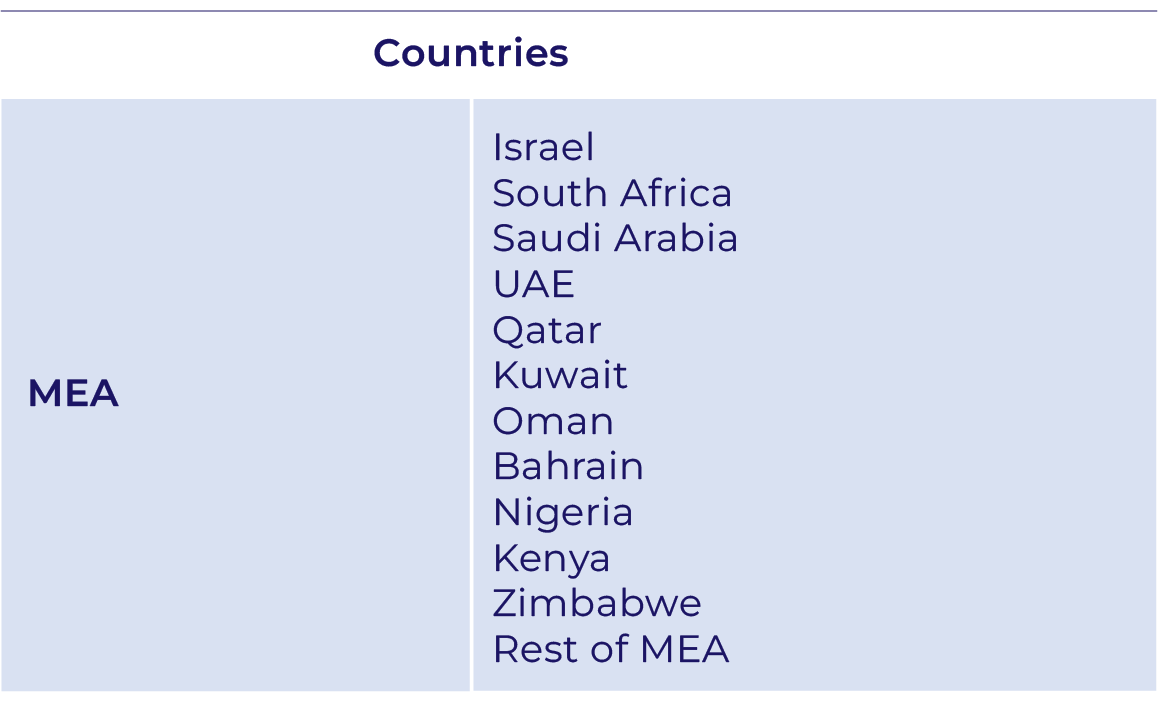
Saudi Arabia UAE Qatar Kuwait Oman Bahrain Turkey South Africa Israel Nigeria Kenya Zimbabwe Rest of MEA

Frequently Asked Questions

Despite hosting one of the world's largest youth populations, MEA's entertainment sector struggles to convert audience engagement into revenue due to fragmented payment infrastructure, limited card-linked subscription rails outside GCC markets, and underdeveloped mobile-money integration with streaming billing systems. Monetization authority remains concentrated among platform intermediaries rather than domestic operators, decoupling audience scale from sustainable revenue conversion.
Independent streaming operators face billing system incompatibility as their primary subscription conversion barrier. Platforms like M-Pesa and Orange Money operate under distinct API architectures that most regional operators lack the technical resources to integrate simultaneously. This fragmentation prevents seamless recurring billing, forcing operators to depend on platform intermediaries that control payment infrastructure, effectively transferring monetization authority away from content originators.
Fragmented rights-management systems across filmed, episodic, and live performance segments prevent independent domestic operators from licensing content efficiently across territory boundaries. Establishing legal infrastructure across multiple MEA jurisdictions requires resources most domestic operators cannot sustain. Multinational distributors holding region-wide rights portfolios maintain structural advantages, leaving locally originated content with limited territory-specific licensing revenue and restricted cross-border commercialization opportunities.
Still have questions? Our research team is here to help you make the right decision.

Table of Contents

1.1 Executive Summary
1.2 Research Methodology
1.3 Scope & Definition
2.1 Industry Overview
2.2 Market Dynamics
2.2.1 Market Drivers
2.2.2 Market Restraints
2.2.3 Market Trends
2.3 Industry Analysis
2.3.1 Value Chain Analysis
2.3.2 Porter's Five Forces Analysis
2.4 Market Indicators
3.1 MEA Entertainment Market Size and Forecast ($), 2019-2034
3.2 MEA Entertainment Market Year-on-Year Growth (%), 2020–2034
4.1 Comparative Market Share Analysis, 2025 & 2034
4.2 Market Size & Forecast ($), 2019-2034
4.2.1 Filmed Entertainment Segment Analysis and Trends
4.2.2 Television & Episodic Entertainment Segment Analysis and Trends
4.2.3 Music & Audio Entertainment Segment Analysis and Trends
4.2.4 Gaming & Interactive Entertainment Segment Analysis and Trends
4.2.5 Live Performance & Event Entertainment Segment Analysis and Trends
4.2.6 Location-Based Entertainment Segment Analysis and Trends
4.3 Market Attractiveness Analysis
5.1 Comparative Market Share Analysis, 2025 & 2034
5.2 Market Size & Forecast ($), 2019-2034
5.2.1 Studio / Publisher-Originated Segment Analysis and Trends
5.2.2 Independent Professional Segment Analysis and Trends
5.2.3 Creator-Led Segment Analysis and Trends
5.2.4 User-Generated Segment Analysis and Trends
5.2.5 Third-Party Acquired / Licensed Segment Analysis and Trends
5.3 Market Attractiveness Analysis
6.1 Comparative Market Share Analysis, 2025 & 2034
6.2 Market Size & Forecast ($), 2019-2034
6.2.1 Ownership Transfer Segment Analysis and Trends
6.2.2 Exclusive Rights Licensing Segment Analysis and Trends
6.2.3 Non-Exclusive Rights Licensing Segment Analysis and Trends
6.2.4 Limited-Term Rights Licensing Segment Analysis and Trends
6.2.5 Territory-Specific Rights Licensing Segment Analysis and Trends
6.2.6 Usage-Specific Rights Licensing Segment Analysis and Trends
6.3 Market Attractiveness Analysis
7.1 Comparative Market Share Analysis, 2025 & 2034
7.2 Market Size & Forecast ($), 2019-2034
7.2.1 Subscription-Based Segment Analysis and Trends
7.2.2 Ad-Supported Segment Analysis and Trends
7.2.3 Transactional (Pay-per-use) Segment Analysis and Trends
7.2.4 Sponsorships/Brand Deals Segment Analysis and Trends
7.2.5 Ticket Sales & Merchandise Segment Analysis and Trends
7.3 Market Attractiveness Analysis
8.1 Comparative Market Share Analysis, 2025 & 2034
8.2 Market Size & Forecast ($), 2019-2034
8.2.1 Individual Consumers Segment Analysis and Trends
8.2.2 Businesses/Advertisers Segment Analysis and Trends
8.2.3 Educational Institutions Segment Analysis and Trends
8.2.4 Corporate Enterprises Segment Analysis and Trends
8.2.5 Gamers & Streamers Segment Analysis and Trends
8.2.6 Others (Social media influencers, Fan communities, Fan communities etc.) Segment Analysis and Trends
8.3 Market Attractiveness Analysis
9.1 Comparative Market Share Analysis By Country, 2025–2034
9.2 Market Size & Forecast ($) By Country, 2019-2034
9.2.1 Saudi Arabia Entertainment Market Analysis
9.2.1.1 Country Trend Analysis
9.2.1.2 Market Size & Forecast ($), 2019-2034
9.2.1.2.1 Content Type
9.2.1.2.2 Content Origin
9.2.1.2.3 Rights Commercialization Type
9.2.1.2.4 Revenue Model
9.2.1.2.5 End User
9.2.2 UAE Entertainment Market Analysis
9.2.2.1 Country Trend Analysis
9.2.2.2 Market Size & Forecast ($), 2019-2034
9.2.2.2.1 Content Type
9.2.2.2.2 Content Origin
9.2.2.2.3 Rights Commercialization Type
9.2.2.2.4 Revenue Model
9.2.2.2.5 End User
9.2.3 Qatar Entertainment Market Analysis
9.2.3.1 Country Trend Analysis
9.2.3.2 Market Size & Forecast ($), 2019-2034
9.2.3.2.1 Content Type
9.2.3.2.2 Content Origin
9.2.3.2.3 Rights Commercialization Type
9.2.3.2.4 Revenue Model
9.2.3.2.5 End User
9.2.4 Kuwait Entertainment Market Analysis
9.2.4.1 Country Trend Analysis
9.2.4.2 Market Size & Forecast ($), 2019-2034
9.2.4.2.1 Content Type
9.2.4.2.2 Content Origin
9.2.4.2.3 Rights Commercialization Type
9.2.4.2.4 Revenue Model
9.2.4.2.5 End User
9.2.5 Oman Entertainment Market Analysis
9.2.5.1 Country Trend Analysis
9.2.5.2 Market Size & Forecast ($), 2019-2034
9.2.5.2.1 Content Type
9.2.5.2.2 Content Origin
9.2.5.2.3 Rights Commercialization Type
9.2.5.2.4 Revenue Model
9.2.5.2.5 End User
9.2.6 Bahrain Entertainment Market Analysis
9.2.6.1 Country Trend Analysis
9.2.6.2 Market Size & Forecast ($), 2019-2034
9.2.6.2.1 Content Type
9.2.6.2.2 Content Origin
9.2.6.2.3 Rights Commercialization Type
9.2.6.2.4 Revenue Model
9.2.6.2.5 End User
9.2.7 Turkey Entertainment Market Analysis
9.2.7.1 Country Trend Analysis
9.2.7.2 Market Size & Forecast ($), 2019-2034
9.2.7.2.1 Content Type
9.2.7.2.2 Content Origin
9.2.7.2.3 Rights Commercialization Type
9.2.7.2.4 Revenue Model
9.2.7.2.5 End User
9.2.8 South Africa Entertainment Market Analysis
9.2.8.1 Country Trend Analysis
9.2.8.2 Market Size & Forecast ($), 2019-2034
9.2.8.2.1 Content Type
9.2.8.2.2 Content Origin
9.2.8.2.3 Rights Commercialization Type
9.2.8.2.4 Revenue Model
9.2.8.2.5 End User
9.2.9 Israel Entertainment Market Analysis
9.2.9.1 Country Trend Analysis
9.2.9.2 Market Size & Forecast ($), 2019-2034
9.2.9.2.1 Content Type
9.2.9.2.2 Content Origin
9.2.9.2.3 Rights Commercialization Type
9.2.9.2.4 Revenue Model
9.2.9.2.5 End User
9.2.10 Nigeria Entertainment Market Analysis
9.2.10.1 Country Trend Analysis
9.2.10.2 Market Size & Forecast ($), 2019-2034
9.2.10.2.1 Content Type
9.2.10.2.2 Content Origin
9.2.10.2.3 Rights Commercialization Type
9.2.10.2.4 Revenue Model
9.2.10.2.5 End User
9.2.11 Kenya Entertainment Market Analysis
9.2.11.1 Country Trend Analysis
9.2.11.2 Market Size & Forecast ($), 2019-2034
9.2.11.2.1 Content Type
9.2.11.2.2 Content Origin
9.2.11.2.3 Rights Commercialization Type
9.2.11.2.4 Revenue Model
9.2.11.2.5 End User
9.2.12 Zimbabwe Entertainment Market Analysis
9.2.12.1 Country Trend Analysis
9.2.12.2 Market Size & Forecast ($), 2019-2034
9.2.12.2.1 Content Type
9.2.12.2.2 Content Origin
9.2.12.2.3 Rights Commercialization Type
9.2.12.2.4 Revenue Model
9.2.12.2.5 End User
9.2.13 Rest of MEA Entertainment Market Analysis
9.2.13.1 Country Trend Analysis
9.2.13.2 Market Size & Forecast ($), 2019-2034
9.2.13.2.1 Content Type
9.2.13.2.2 Content Origin
9.2.13.2.3 Rights Commercialization Type
9.2.13.2.4 Revenue Model
9.2.13.2.5 End User
9.3 Market Attractiveness by Country
10.1 Market Share Analysis
10.2 Competitive Positioning Matrix
10.3 Key Winning Strategies & Impact

Paid Customization

Tailor This Report to Your Exact Needs

All customization options are available on request. Our team will scope your requirements and provide a proposal within 48 hours.

Additional Country / Regional Coverage
Extend the report to include any additional country or sub-regional market not covered in the standard version.
Premium
Granular Segment-Level Analysis
Deeper breakdowns by sub-device category, patient sub-groups, or specific procedure types with volume and revenue data.
Premium
Competitor Benchmarking & Profiles
In-depth profiles of up to 10 additional companies including financials, product portfolios, and strategic initiatives.
Premium
Executive Summary Presentation Deck (PPT)
A ready-to-present PowerPoint deck summarizing key findings, charts, and strategic insights tailored to your audience.
Add-On
Custom Forecast Scenarios (Bull / Base / Bear)
Scenario-based modelling to stress-test market assumptions across optimistic, base-case, and conservative growth trajectories.
Premium
Regulatory & Compliance Deep-Dive
Comprehensive mapping of MDR/IVDR compliance, import regulations, clinical trial requirements, and approval pathway analysis for Turkey.
Add-On
Supply Chain & Distribution Mapping
End-to-end supply chain visualization including manufacturer, distributor, and end-user touchpoints with bottleneck risk identification.
Premium
Market Entry Strategy Advisory
Strategic market entry guidance including go-to-market planning, partner identification, pricing benchmarks, and competitive positioning.
Advisory
Ready to customize this report? Share your requirements and our research team will send you a detailed proposal with timelines and pricing within 48 hours.

Request a Free Sample

What Your Sample Includes
  • Executive Summary & Strategic Market Overview
  • Key market sizing metrics with CAGR projections
  • Representative data tables, charts & segment breakdowns
  • Competitive landscape preview with leading player profiles
  • Methodology note and data validation framework
Delivery & Access
  • Delivered to your corporate inbox within 24 business hours
  • Available in PDF format — no login or download barrier
  • Accompanied by a dedicated research analyst introduction
  • Option to schedule a complimentary 15-minute briefing call
Trust & Compliance
  • SSL-encrypted submission — your data is transmitted securely
  • GDPR-compliant data handling — zero third-party sharing
  • Trusted by 500+ Fortune 1000 companies & government bodies
  • ISO-aligned research processes with independent data validation

No commitment required. No credit card. Delivered within 24 business hours.

SSL Secured GDPR Compliant No Spam Policy 500+ Enterprise Clients
Read