
Oman Connector Market Size and Forecast by Product Type, Price Range, End Product, Voltage Range, and Distribution Channel: 2019-2033
July 2025
| Format:

 |
Pages: 110+
|
Type: Industry Report
|
Authors:
David Gomes
(Manager – Semiconductor)
|
Pages: 110+
|
Type: Industry Report
|
Authors:
David Gomes
(Manager – Semiconductor)
MARKET OUTLOOK
Oman Connector Market Outlook
Standardized, Rapid-Deploy Connectors Catalyze Oman’s Cloud Infrastructure and Edge Device Expansion
Oman is undergoing a significant transformation in its digital infrastructure, with cloud computing, edge data centers, and smart healthcare systems forming the backbone of its innovation agenda. As these technologies take root, the connector market in Oman has emerged as a critical enabler. The national shift toward compliance-ready, modular, and easily deployable connector formats aligns directly with the country’s efforts to accelerate tech deployment in both government and private sectors. This trend is particularly evident in the demand for snap-in connectors, push-pull systems, and standardized telecom interfaces that allow for streamlined, high-speed installations across data centers and medical devices.
According to DataCube Research, Oman connector market is projected to reach USD 121.3 million by 2025 and is forecast to grow to USD 205.8 million by 2033, registering a compound annual growth rate (CAGR) of 6.7% from 2025 to 2033. Key growth drivers include the expansion of telecom infrastructure, smart hospital deployments, and automation in energy and logistics sectors. Rapid cloud adoption has also generated higher demand for PCB connectors and terminal block solutions, given their compatibility with dense server architectures and distributed edge hardware. As Oman continues its digital modernization, the connector ecosystem is positioned as an indispensable layer within its evolving technological landscape.
Strategic National Investment and Regional Infrastructure Projects Drive Market Expansion
Oman connector industry is gaining momentum, powered by targeted government investments and cross-border digital initiatives. The rollout of the National Broadband Strategy and the establishment of local data centers, including those operated by Equinix and Ooredoo, are increasing demand for high-density, modular interconnects. Additionally, the Sultanate’s geographic proximity to the Middle East, Asia, and East Africa makes it an ideal node in regional data transmission, leading to a surge in connector applications for telecom routers and submarine cable interfaces.
Medical modernization also plays a crucial role. Oman’s Ministry of Health has prioritized the deployment of connected diagnostic and imaging equipment under its Health Vision 2050 plan. This drives demand for circular connectors and sealed interfaces suited for sterile environments. On the industrial front, sectors such as oil and gas, port logistics, and automotive repair are integrating sensor-based automation platforms, increasing the requirement for ruggedized and field-deployable connectors.
However, growth is challenged by the high cost of skilled labor and limited local manufacturing capacity. Many OEMs rely on imported semi-finished connector assemblies, creating dependencies that can delay project timelines. Additionally, interoperability between legacy and new-generation systems remains a barrier, particularly in retrofitting scenarios across Oman’s aging utility and industrial infrastructure.
Edge-Native Design and Plug-and-Play Configurations Transform Connector Engineering in Oman
One of the most defining trends in Oman connector market is the prioritization of edge-native architectures. As micro-data centers and localized automation hubs become more widespread, demand is shifting toward plug-and-play connectors that support easy maintenance and upgrade paths. Snap-in telecom connectors and modular push-pull formats are becoming the standard in these applications due to their efficiency in high-turnover environments.
Another trend is the integration of simulation-ready connector libraries, especially within Oman’s growing cohort of electronic prototyping startups. These tools allow engineers to test EMI performance, heat tolerance, and compliance parameters in virtual environments before committing to physical builds. Given the country’s rising number of innovation hubs, such as Knowledge Oasis Muscat, there’s an expanding opportunity for connector manufacturers to align with rapid prototyping and low-volume precision production.
Opportunities also lie in the growing importance of clean energy and sustainability. Oman’s Green Hydrogen Strategy and solar farm expansions are bringing high-voltage and weather-resistant connectors into sharper focus. Terminal blocks and RF connectors with advanced sealing are expected to see increased adoption across solar inverters, battery packs, and field-monitoring devices.
Omani Regulatory Framework Supports Standards Compliance and Circular Supply Chain Objectives
Regulatory compliance in the Oman connector sector is tightly aligned with international and regional benchmarks. The Public Authority for Special Economic Zones and Free Zones (OPAZ) mandates industrial standards that prioritize product modularity and recyclability. Meanwhile, the Telecommunications Regulatory Authority (TRA) enforces technical compliance for telecom connectors used in national broadband infrastructure.
Oman also aligns with the Gulf Standardization Organization (GSO) on electronic product safety and performance benchmarks. These guidelines influence the materials and geometries used in circular, PCB, and I/O connectors across both public and private sector projects. Furthermore, the government's push for import substitution through the In-Country Value (ICV) initiative encourages foreign connector manufacturers to establish regional production or sourcing capabilities, stimulating local connector assembly and packaging services.
Skilled Labor Scarcity and Compliance Demands Shape Connector Deployment Strategy
Two critical economic variables impacting the Omani connector market are product safety audit frequency and skilled labor availability. Connector systems used in medical and industrial automation sectors must undergo routine audits, often necessitating rigorous documentation and traceability protocols. These requirements, while essential, increase compliance costs, especially for small and mid-sized connector suppliers.
Additionally, the availability of certified technicians and production engineers remains limited in Oman. This skills gap has forced many enterprises to depend on overseas talent or outsourced manufacturing, which introduces logistical and time-to-market delays. However, government efforts to train a local tech workforce through institutions such as the Vocational Training Authority (VTA) are expected to gradually alleviate this constraint by 2027–2028. In the interim, manufacturers must design connector platforms that are serviceable, modular, and intuitive to install with minimal technical intervention.
Oman Connector Market Sees Strategic Collaborations and Field-Centric Support Services
The competitive landscape in Oman connector industry is seeing diversification, with both regional and international players adopting support-intensive and proximity-based strategies. Key global connector brands like TE Connectivity, Phoenix Contact, and Amphenol are expanding their presence through channel partnerships and regional hubs in Muscat and Sohar. Simultaneously, local firms such as ConnectGulf are gaining traction by offering aftermarket services that cater to Omani-specific operational challenges.
In February 2025, ConnectGulf launched a mobile technical inspection unit that provides on-site connector diagnostics and replacement for industrial parks and marine terminals. This aftermarket model allows customers to reduce downtime and ensure continuous compliance during maintenance audits. As rugged use environments persist in logistics and oilfield operations, IP-rated and corrosion-resistant connectors are gaining preference.
Strategies such as vertical integration, standards-aligned rapid deployment kits, and local stocking centers are becoming common among industry leaders. These approaches reduce lead times, enable tailored compliance documentation, and improve engagement with system integrators across key Omani industries.
Oman Connector Ecosystem Strengthens Through Technological Alignment and Market Localization
The outlook for Oman connector market reflects a balanced trajectory of regional relevance and technological evolution. The nation’s strategic investments in cloud computing, smart healthcare, and localized manufacturing are setting a solid foundation for sustainable growth in the connector industry. Despite challenges around interoperability and talent acquisition, the push toward modular, easy-to-deploy connector formats is unlocking new value across sectors.
Organizations aiming to enter or expand within Oman connector sector must focus on product adaptability, edge-computing compatibility, and rapid deployment capabilities. Leveraging standardized connector formats not only enhances compliance but also streamlines customer integration experiences. As Oman strengthens its reputation as a digital and industrial transformation hub, the connector industry will continue to benefit from multi-sectoral demand.
*Research Methodology: This report is based on DataCube’s proprietary 3-stage forecasting model, combining primary research, secondary data triangulation, and expert validation.
[Learn more]
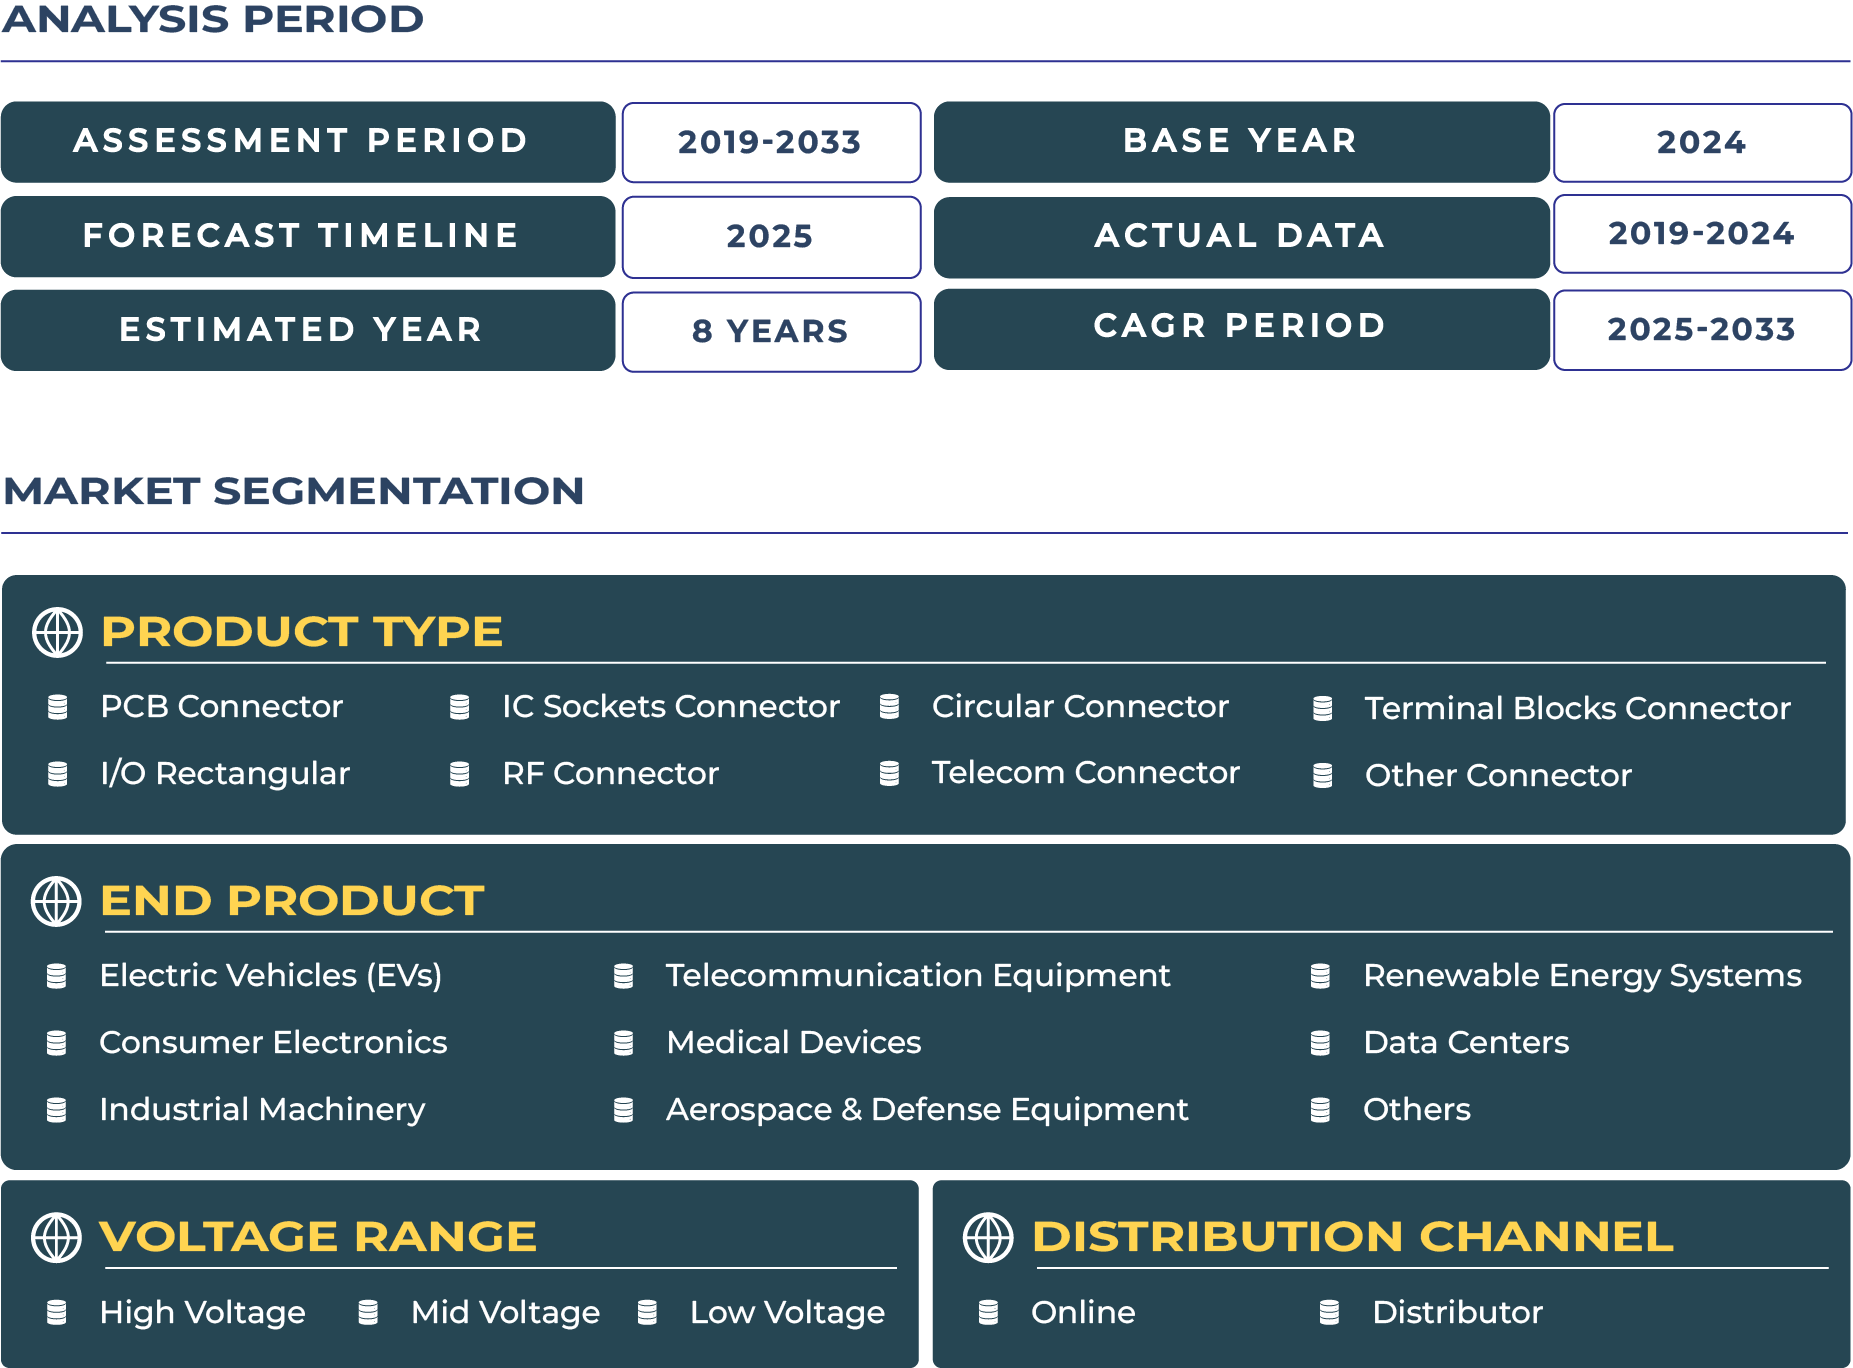
Oman Connector Market Segmentation
Frequently Asked Questions
Standardized connectors streamline integration, reduce deployment time, and ensure regulatory compliance in data centers and medical device installations.
Modular, simulation-ready connector kits allow engineers to iterate quickly during design cycles, supporting Oman’s emerging electronics startups.
Push-pull designs provide easy-to-install, secure interfaces for industries like telecom, healthcare, and automation, especially in high-turnover or remote settings.
Related Reports

Nigeria PaaS Market Size | 2019-2033
- Report ID: IT1922 | Coverage: Country |
- Category: Information Technology | Sub-Category: Cloud Computing Technology |
- Published Date: Dec 2025 | US$495 |
Argentina Cardiovascular Devices Market Size | 2019-2033
- Report ID: HEA90 | Coverage: Country |
- Category: Healthcare | Sub-Category: Medical Devices |
- Published Date: Sep 2025 | US$495 |
Nigeria PaaS Market Size | 2019-2033
- Report ID: IT1922 | Coverage:Country |
- Category:Information Technology | Sub-Category: Cloud Computing Technology |
- Published Date: Dec 2025 |US$495 |
Argentina Cardiovascular Devices Market Size | 2019-2033
- Report ID: HEA90 | Coverage:Country |
- Category:Healthcare | Sub-Category: Medical Devices |
- Published Date: Sep 2025 |US$495 |
Why Choose Us

24/5 Research Support
Get your queries resolved prior to and post purchasing research study

Customize As Per Specific Requirements
Get in-depth analysis based on your tailored research needs

Expertise in Tracking Niche Markets
Comprehensive view of latest technologies and opportunities across markets

360-Degree Analysis
Fact-based insights derived through supply & demand side analysis

Assured Quality
Deliver most accurate industry insights to maintain research quality

Information Security
Your confidential and personal data is secure and safe