UK Corporate Banking Market Size and Forecast by Service Type, Avoid including: Cash pooling Liquidity management Virtual accounts), Banking Type, Delivery Channel, Customer Type, and Revenue Model: 2019-2034

Jul 2026
Format:
PDF Excel
Pages: 110+
Type: Sub-Industry Report
USD 511.18 Billion
Market Size 2026
USD 716.74 Billion
Forecast 2034
4.32%
CAGR 2026–2034

Unlike continental European peers constrained by fragmented platforms, UK institutions benefit from a mature

UK Corporate Banking Market Size | 2019-2034
Banking and Finance
Banking Services

Market Outlook

  • In 2026, the market in UK is projected to account for USD 511.18 Billion.
  • Industry forecasts indicate the UK Corporate Banking Market will attain USD 716.74 Billion by 2034, yielding a CAGR of 4.32% during the forecast interval.
Industry Shift: UK's Non-Interest Revenue Concentration in Clearing
A mature payments clearing architecture, anchored by a small number of systemically significant institutions, is concentrating transaction banking fee income within a structurally narrow competitive tier, suggesting mid-market challengers face compounding access barriers in high-volume payment corridors.

Payments Infrastructure Maturity Reshapes UK Institutional Revenue Mix

The moment the Faster Payments Service reached near-universal institutional participation among UK-domiciled banks, it ceased to function merely as a settlement utility and began operating as a structural determinant of competitive positioning in the UK corporate banking sector. Access to real-time clearing rails and the CHAPS high-value interbank system is not equally distributed across the market — direct settlement membership remains concentrated among a limited number of systemically significant institutions, while a larger tier of banks and non-bank challengers accesses these rails indirectly, accepting per-transaction cost asymmetries that structurally compress their non-interest income margins. The consequence for payment and transaction banking revenues is a persistent concentration effect: banks holding direct CHAPS and Faster Payments membership capture a disproportionate share of fee income generated by high-volume corporate payment flows, since their cost-to-process advantage compounds across large-enterprise and institutional client mandates at scale.

Continental European corporate banking markets, still rationalising legacy domestic rails alongside the SEPA Instant Credit Transfer framework, face platform fragmentation that the UK largely resolved through earlier infrastructure consolidation. That resolution, arguably the more consequential structural development for current revenue composition, means UK relationship banks are competing less on payment rail access and more on the treasury analytics, FX execution, and working capital overlay services layered above that infrastructure. For mid-market enterprises and large corporates operating within the UK corporate banking market, this maturity introduces a different kind of lock-in — not the technical lock-in of incompatible platforms, but the commercial lock-in of deeply embedded cash management relationships held by the same institutions that own direct clearing access. Whether challenger banks and fintech-affiliated corporate platforms can structurally erode that position may depend less on product innovation than on regulatory decisions governing indirect access pricing under the Payment Systems Regulator's oversight.

Direct Settlement Access: Fee Income Concentration Among Tier-One Members

Corporate payment revenues in the UK corporate banking sector have accumulated disproportionately among the small group of institutions holding direct CHAPS and Faster Payments Service membership, rather than distributing competitively across the broader market. The mechanism is a per-transaction cost asymmetry: indirect participants — including challenger banks and second-tier commercial lenders — access real-time clearing rails at a structural cost premium imposed by their sponsoring settlement agents, which compresses non-interest income margins on high-volume corporate mandates precisely where scale economics would otherwise reward them. Large enterprises and institutional clients routing material payment volumes tend to consolidate transaction banking relationships with direct members, since the fee structures those institutions offer cannot be replicated by indirect participants absorbing pass-through processing costs. The Payment Systems Regulator's ongoing access and governance reviews indicate that this settlement architecture creates a durable concentration effect, rather than a transient competitive imbalance, limiting the capacity of non-direct members to compete effectively for fee-intensive corporate transaction banking mandates.

Indirect Participants Have Sought Clearing Cost Reduction

Challenger banks and second-tier commercial lenders accessing Faster Payments Service and CHAPS rails indirectly bear a structural per-transaction cost premium imposed by sponsoring settlement agents, which erodes non-interest income margins on high-volume corporate mandates. Technology vendors providing payment orchestration and settlement optimisation platforms have an addressable opportunity here: indirect participants require middleware capable of aggregating, routing, and netting corporate payment flows to reduce the volume of individually priced clearing instructions passed to sponsors. The Payment Systems Regulator's access governance reviews reinforce the commercial urgency, as indirect members facing sustained margin compression are more likely to invest in cost-mitigation infrastructure than to wait for structural access reform to redistribute settlement economics in their favour.

Settlement Membership Concentration Shapes Corporate Fee Revenue

Investment in direct CHAPS and Faster Payments Service membership infrastructure flows predominantly toward the small cohort of systemically significant UK banks already holding settlement agent status, while indirect participants — challenger banks and second-tier commercial lenders — allocate capital instead toward middleware and payment orchestration layers that partially offset, but do not eliminate, the per-transaction cost premium imposed by sponsoring institutions. The most direct observable indicator of this dynamic is the proportion of high-value corporate payment volumes processed through direct versus indirect settlement channels, a distribution that the Payment Systems Regulator's access and governance reviews have identified as persistently concentrated among a limited number of direct members. At least in part because large enterprises and institutional clients consolidate transaction banking mandates with direct members for fee structure reasons, indirect participants capture a structurally smaller share of fee-intensive corporate payment revenues regardless of their product breadth. The more consequential implication, given that direct membership capital requirements remain prohibitive for most non-bank challengers, is that non-interest income from corporate payment flows in the UK corporate banking industry is unlikely to redistribute competitively without a material change in the settlement access architecture overseen by the regulator.

Corporate Fee Revenue Contingent on Unresolved Settlement Access

The less visible dynamic is that non-interest income growth among indirect Faster Payments Service and CHAPS participants depends entirely on a prerequisite — Payment Systems Regulator access reform — that remains procedurally unresolved rather than imminent. The structural mechanism operates as follows: indirect participants absorbing per-transaction cost premiums from sponsoring settlement agents cannot price corporate payment mandates competitively against direct members, meaning their non-interest income share contracts as enterprise clients migrate transaction volumes toward fee-advantaged direct members. Mid-tier commercial lenders serving mid-market enterprises are the most exposed cohort, since their corporate client base generates sufficient payment volume to make the cost asymmetry material, yet insufficient balance sheet scale to meet direct membership capital thresholds. The more consequential barrier, given that regulatory access reform timelines remain uncertain, is that fee income redistribution within the UK corporate banking industry is structurally contingent on an external policy prerequisite rather than on any commercial or technological investment that indirect participants can independently execute.

UK Corporate Banking's Settlement Tier Divide Defines Fee Income

Fee income concentration — rather than product breadth — is the organising principle of competition in the UK corporate banking sector. HSBC, Barclays, NatWest Group, and Lloyds Banking Group hold direct CHAPS membership, positioning each as a settlement agent for a large population of indirect participants and capturing the structural per-transaction cost advantage that accrues to principals in agency clearing arrangements. The more consequential competitive reality, given that CHAPS direct participation at end-2025 stood at 38 domestic and international financial institutions serving several thousand indirect participants, is that the fee economics of high-value corporate payment flows remain concentrated among a narrow group of established operators whose clearing cost base cannot be replicated by indirect access peers.

Across the field of leading providers, the dominant strategic pattern is investment in ISO 20022 enhanced data capability as a competitive differentiator within the existing settlement hierarchy rather than a challenge to it. The Bank of England mandated ISO 20022 enhanced data, including Purpose Codes and Legal Entity Identifiers, for certain CHAPS payments from May 2025 — a requirement that favours direct members with the operational infrastructure to enrich payment messages at scale, and that indirect participants must meet at additional compliance cost passed from sponsoring agents. At least in part because the Bank of England's RTGS Renewal Programme completed its final transition stage in April 2025, establishing a new core ledger, the first new CHAPS onboardings post-transition are expected in early 2026, indicating that competitive entry into direct membership remains structurally sequential rather than open.

The settlement access calculus directly shapes which institutions can compete for large-enterprise and institutional transaction banking mandates where fee structures, not relationship tenure, determine award outcomes. As CHAPS infrastructure matures under the renewed RTGS platform and the Bank of England formally evaluates replacement infrastructure for consumer payment rails, direct members holding established corporate payment franchises are positioned to capture any incremental fee revenue generated by higher transaction volumes, while indirect participants' non-interest income from payment services remains contingent on the pace and scope of access policy decisions that neither commercial investment nor technology adoption can substitute for independently.

Market Scope

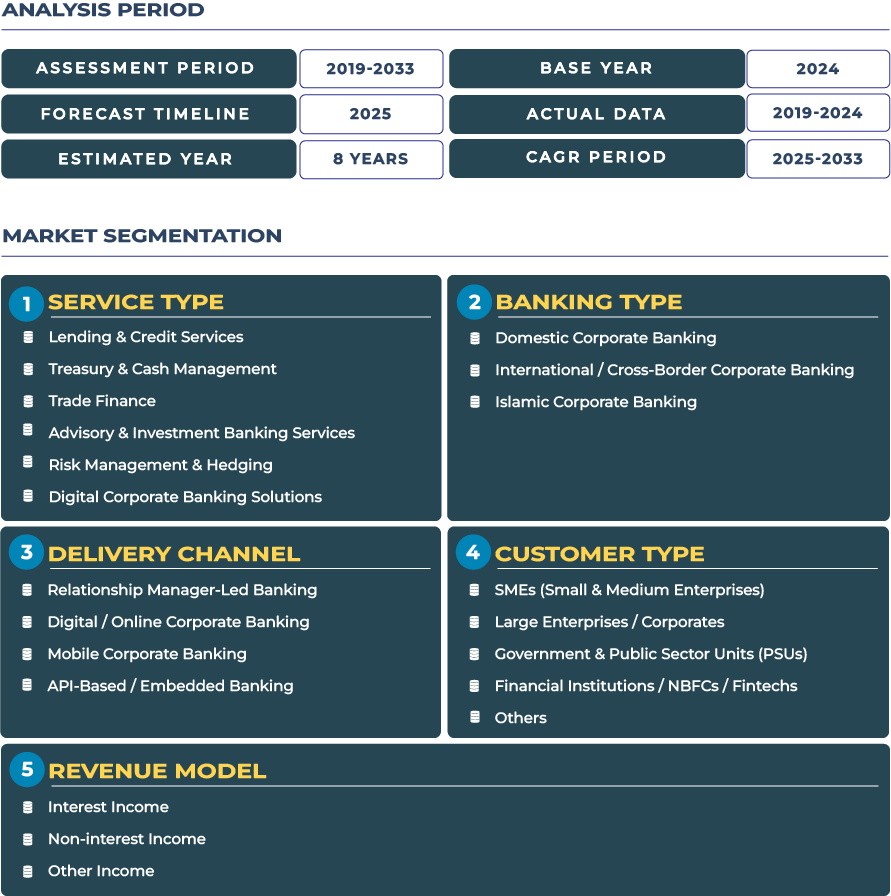
Comprehensive breakdown of market scope across key dimensions View Full Methodology
Segment Dimension
Segment Items
Service Type
Corporate Deposit Services Corporate Lending Services Cash Management Services Payment & Transaction Banking Services (limit it to
Payment & Transaction Banking Services (limit it to
Domestic Payments Cross-border Payments Wire Transfers ACH Payroll Payments Collections
Avoid including: Cash pooling Liquidity management Virtual accounts)
Trade Finance Services Treasury & Foreign Exchange Services (limited to Supply Chain Finance Services (Avoid invoice discounting that is already classified under Working Capital Lending.) Custody & Corporate Trust Services
Treasury & Foreign Exchange Services (limited to
FX Money Market Hedging Interest Rate Risk Commodity Hedging Do not include liquidity management because Cash Management already owns it.)
Banking Type
Conventional Corporate Banking Cross-Border Corporate Banking Islamic Corporate Banking
Delivery Channel
Branch & Relationship Banking Online Banking Portal Mobile Banking API Banking
Customer Type
SMEs Mid-Market Enterprises Large Enterprises Government & Public Sector Financial Institutions
Revenue Model
Interest Income Non-interest Income Other Income

Frequently Asked Questions

Direct CHAPS and Faster Payments membership creates a structural cost advantage for tier-one institutions. Indirect participants, including challenger banks, pay per-transaction premiums to sponsoring agents, compressing their non-interest income margins on high-volume corporate mandates. This asymmetry allows direct members to capture disproportionate payment fee revenues, particularly across large-enterprise and institutional client portfolios where scale economics amplify the competitive gap.
Once real-time clearing rails achieve near-universal institutional participation, payment access ceases to be a differentiator. Competition migrates upward to value-added services layered above infrastructure — treasury analytics, FX execution, hedging, and working capital overlays. Banks that resolved legacy platform fragmentation early can redirect investment toward these higher-margin advisory and transactional services rather than infrastructure remediation, strengthening revenue diversification within non-interest income streams.
The Payment Systems Regulator's oversight of indirect access pricing represents the primary structural lever. If regulatory decisions compress the cost premium that sponsoring settlement agents impose on indirect participants, challengers could compete more effectively on high-volume corporate mandates. Absent such intervention, incumbent advantages derived from direct clearing membership and embedded cash management relationships are likely to persist, limiting competitive disruption primarily to product innovation rather than pricing parity.
Still have questions? Our research team is here to help you make the right decision.

Table of Contents

1.1 Executive Summary
1.2 Research Methodology
1.3 Scope & Definition
2.1 Industry Overview
2.2 Market Dynamics
2.2.1 Market Drivers
2.2.2 Market Restraints
2.2.3 Market Trends
2.3 Industry Analysis
2.3.1 Value Chain Analysis
2.3.2 Porter's Five Forces Analysis
2.4 Market Indicators
3.1 UK Corporate Banking Market Size and Forecast ($), 2019-2034
3.2 UK Corporate Banking Market Year-on-Year Growth (%), 2020–2034
4.1 Comparative Market Share Analysis, 2025 & 2034
4.2 Market Size & Forecast ($), 2019-2034
4.2.1 Corporate Deposit Services Segment Analysis and Trends
4.2.2 Corporate Lending Services Segment Analysis and Trends
4.2.3 Cash Management Services Segment Analysis and Trends
4.2.4 Payment & Transaction Banking Services (limit it to Segment Analysis and Trends
4.2.4.1 Domestic Payments Cross-border Payments Wire Transfers ACH Payroll Payments Collections
4.3 Market Attractiveness Analysis
5.1 Comparative Market Share Analysis, 2025 & 2034
5.2 Market Size & Forecast ($), 2019-2034
5.2.1 Trade Finance Services Segment Analysis and Trends
5.2.2 Treasury & Foreign Exchange Services (limited to Segment Analysis and Trends
5.2.2.1 FX Money Market Hedging Interest Rate Risk Commodity Hedging Do not include liquidity management because Cash Management already owns it.)
5.2.3 Supply Chain Finance Services (Avoid invoice discounting that is already classified under Working Capital Lending.) Segment Analysis and Trends
5.2.4 Custody & Corporate Trust Services Segment Analysis and Trends
5.3 Market Attractiveness Analysis
6.1 Comparative Market Share Analysis, 2025 & 2034
6.2 Market Size & Forecast ($), 2019-2034
6.2.1 Conventional Corporate Banking Segment Analysis and Trends
6.2.2 Cross-Border Corporate Banking Segment Analysis and Trends
6.2.3 Islamic Corporate Banking Segment Analysis and Trends
6.3 Market Attractiveness Analysis
7.1 Comparative Market Share Analysis, 2025 & 2034
7.2 Market Size & Forecast ($), 2019-2034
7.2.1 Branch & Relationship Banking Segment Analysis and Trends
7.2.2 Online Banking Portal Segment Analysis and Trends
7.2.3 Mobile Banking Segment Analysis and Trends
7.2.4 API Banking Segment Analysis and Trends
7.3 Market Attractiveness Analysis
8.1 Comparative Market Share Analysis, 2025 & 2034
8.2 Market Size & Forecast ($), 2019-2034
8.2.1 SMEs Segment Analysis and Trends
8.2.2 Mid-Market Enterprises Segment Analysis and Trends
8.2.3 Large Enterprises Segment Analysis and Trends
8.2.4 Government & Public Sector Segment Analysis and Trends
8.2.5 Financial Institutions Segment Analysis and Trends
8.3 Market Attractiveness Analysis
9.1 Comparative Market Share Analysis, 2025 & 2034
9.2 Market Size & Forecast ($), 2019-2034
9.2.1 Interest Income Segment Analysis and Trends
9.2.2 Non-interest Income Segment Analysis and Trends
9.2.3 Other Income Segment Analysis and Trends
9.3 Market Attractiveness Analysis
10.1 Market Share Analysis
10.2 Competitive Positioning Matrix
10.3 Key Winning Strategies & Impact

Paid Customization

Tailor This Report to Your Exact Needs

All customization options are available on request. Our team will scope your requirements and provide a proposal within 48 hours.

Additional Country / Regional Coverage
Extend the report to include any additional country or sub-regional market not covered in the standard version.
Premium
Granular Segment-Level Analysis
Deeper breakdowns by sub-device category, patient sub-groups, or specific procedure types with volume and revenue data.
Premium
Competitor Benchmarking & Profiles
In-depth profiles of up to 10 additional companies including financials, product portfolios, and strategic initiatives.
Premium
Executive Summary Presentation Deck (PPT)
A ready-to-present PowerPoint deck summarizing key findings, charts, and strategic insights tailored to your audience.
Add-On
Custom Forecast Scenarios (Bull / Base / Bear)
Scenario-based modelling to stress-test market assumptions across optimistic, base-case, and conservative growth trajectories.
Premium
Regulatory & Compliance Deep-Dive
Comprehensive mapping of MDR/IVDR compliance, import regulations, clinical trial requirements, and approval pathway analysis for Turkey.
Add-On
Supply Chain & Distribution Mapping
End-to-end supply chain visualization including manufacturer, distributor, and end-user touchpoints with bottleneck risk identification.
Premium
Market Entry Strategy Advisory
Strategic market entry guidance including go-to-market planning, partner identification, pricing benchmarks, and competitive positioning.
Advisory
Ready to customize this report? Share your requirements and our research team will send you a detailed proposal with timelines and pricing within 48 hours.

Request a Free Sample

What Your Sample Includes
  • Executive Summary & Strategic Market Overview
  • Key market sizing metrics with CAGR projections
  • Representative data tables, charts & segment breakdowns
  • Competitive landscape preview with leading player profiles
  • Methodology note and data validation framework
Delivery & Access
  • Delivered to your corporate inbox within 24 business hours
  • Available in PDF format — no login or download barrier
  • Accompanied by a dedicated research analyst introduction
  • Option to schedule a complimentary 15-minute briefing call
Trust & Compliance
  • SSL-encrypted submission — your data is transmitted securely
  • GDPR-compliant data handling — zero third-party sharing
  • Trusted by 500+ Fortune 1000 companies & government bodies
  • ISO-aligned research processes with independent data validation

No commitment required. No credit card. Delivered within 24 business hours.

SSL Secured GDPR Compliant No Spam Policy 500+ Enterprise Clients
Read